

Understanding the Social Security Disability Benefits Pay Chart
When you are approved for Social Security Disability Insurance (SSDI), one of the first questions you may ask is: “How much will I get paid each month?” The answer is found in the Social Security Disability benefits pay chart information.
The pay chart shows average monthly payments based on the year, your work history, and how much you have paid into Social Security. The Social Security Administration (SSA) updates these numbers each year.
In 2026, the average SSDI payment is around $1,500 per month, but the actual amount can be higher or lower depending on your earnings record.
How the Social Securitiy Disability Benefits Pay Chart Works
The pay chart is not the same as a flat rate. Instead, your monthly SSDI benefit is based on:
- Lifetime earnings: The more you worked and paid into Social Security, the higher your benefit.
- Disability onset date: This affects how much back pay you may receive.
- Cost-of-Living Adjustments (COLA): Each year, the SSA adjusts payments to keep up with inflation.
For example:
- Someone who earned low wages over their career may get around $1,000 a month.
- Someone with higher lifetime earnings could receive closer to $3,000 a month.
SSDI vs. SSI Pay Chart
Many people confuse SSDI with Supplemental Security Income (SSI). SSI is different. It is a need-based program with a set federal maximum payment. In 2026, the maximum federal SSI payment is about $994 per month for an individual.
SSDI, by contrast, depends on your work record and can vary widely.
What Impacts Your Payment
Several factors can change what you see on the pay chart:
- Other benefits – If you receive workers’ compensation or certain public disability benefits, your SSDI may be reduced.
- Taxes – A portion of your SSDI benefits may be taxable if your household income is above a certain level.
- Family benefits – Dependents, such as children or a spouse, may also qualify for benefits, which can increase the household total.
Back Pay and Lump-Sum Payments
When you are approved, you may also receive back pay. Back pay covers the time between when you became disabled and when your claim is approved. This can be several months or even years.
The SSA usually pays back pay as a lump sum, which can be thousands of dollars. This is separate from your monthly SSDI payments.
Why the Pay Chart Matters
The pay chart helps you:
- Understand your expected monthly income.
- Plan your budget while you wait for approval.
- Estimate how COLA changes will affect you.
How Cost of Living Impacts Social Security Disability Payments
Anyone receiving Social Security disability or retirement benefits is subject to the Social Security Administration’s (SSA) COLA, or “Cost of Living Adjustment.” As the cost of common household goods increase, SSA adjusts benefits upward at a comparable rate.
To arrive at their decision, SSA uses various tools to analyze cost increases nationally. The most well-known index is the Consumer Price Index. Since 1975, Social Security’s general benefit increases have been based on increases in the Consumer Price Index.
Because the cost of goods increase at different rates in different areas, the SSA uses a tool called an index. An index gathers data from many sources. Since 1975, Social Security’s general benefit increases have been based on increases in the cost of living as measured by the Consumer Price Index.
Another commonly used index is the Meric cost of living index. It derives the cost of living index for each state by averaging the indices of participating cities and metropolitan areas in that state. And, since 1968, the Council for Community and Economic Research (C2ER), has also published a popular cost index.
2026 Social Security Disability Benefits Pay Chart
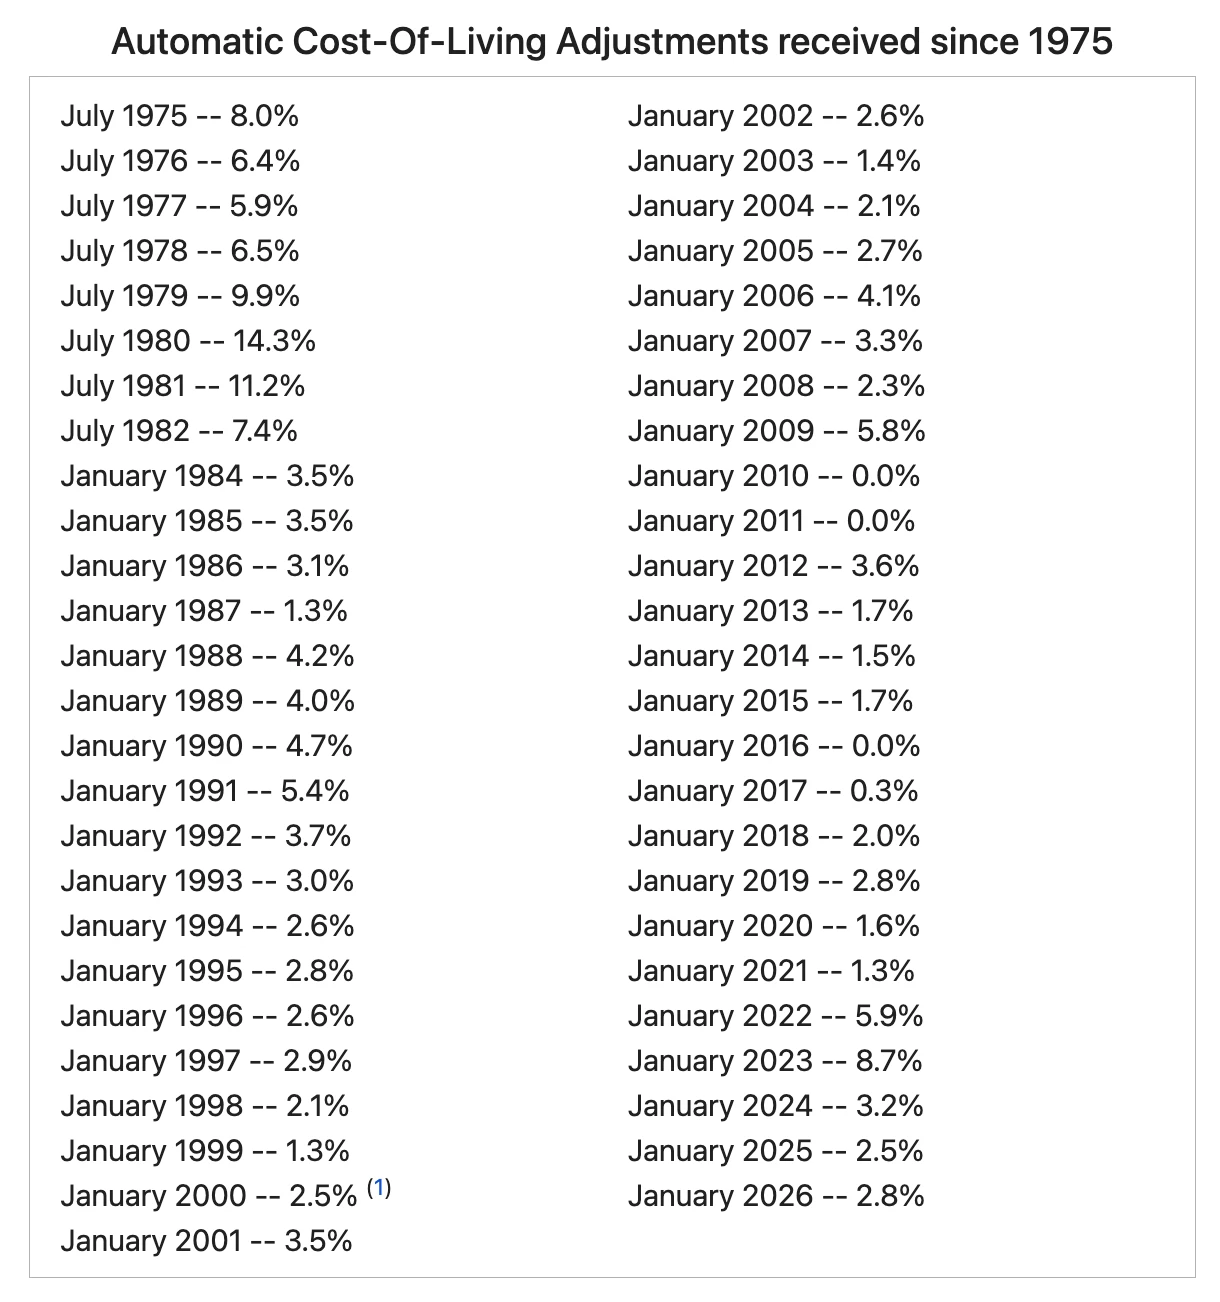
Last week, the SSA announced an 2.8 percent cost-of-living-adjustment (COLA). This was a slight increase from last year’s 2.5-percent COLA. Over the last year, you may have noticed increases in the price of common household goods. And in the overall cost of living in North Carolina. The COLA adjustment should provide needed relief to disability claimants impacted by rising prices.
Below, you can find a list of historic COLA’s from SSA.gov.
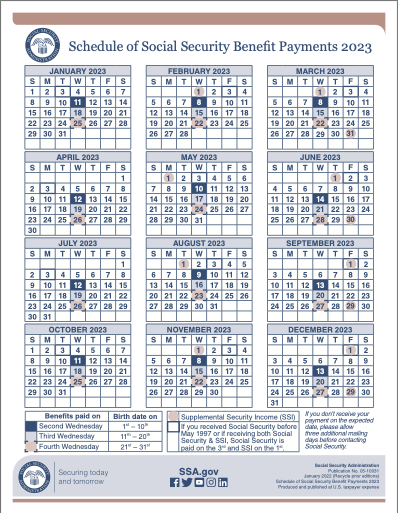
Similar to years past, claimants receive their Social Security payments based on their day of birth. If a claimant’s birthdate falls in the range of the 1st through the 10th, they receive their Social Security Disability payments on the second Wednesday of the month. Birthdates between the 11thand the 20th receive their payment on the third Wednesday of each month. And birthdates between the 21stand 31st receive their payments on the fourth Wednesday of the month.
Help Applying for Social Security Disability Benefits in 2026
The SSDI pay chart shows that payments are based on your past work and earnings, not a flat number. Most people in 2026 receive between $1,000 and $3,000 a month. Knowing where you fall on the chart helps you prepare for your financial future.
This content is provided by Collins Price, PLLC, a local disability law firm in NC helping claimants file for or appeal recently denied SSI and SSDI claims. If you’re considering applying for disability benefits, and would like a free consultation on your claim, contact one of our Social Security disability lawyers today. There is never a fee for our services unless we win your claim and no obligation to hire us following the free consultation.
Given the cost of living increases and the updated 2026 Disability payment schedules, qualified claimants should consider filing for SSDI or SSI benefits.